After semi-long intervals, we take a look
at the Dow Jones index (DJI) using traditional technical analysis to
know the current status of the USA stock market, and honestly, we find
very useful technical lessons that deserve attention.
Here, for example, in this article, we look at the
Dow Jones index (DJI) on a daily time scale and see that it deals with
technical patterns very professionally, achieving the set goals.
Technical Analysis on daily scale chart.
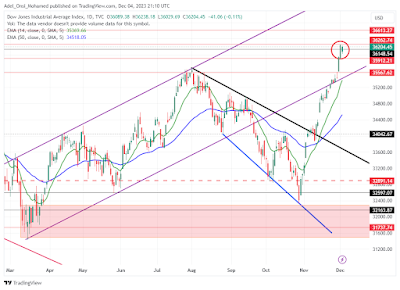
Currently, if you look at the following chart between the black descending
line and the descending blue line, you will find a very famous technical
pattern, which is called Descending Broadening Wedge, here it is an
ideal pattern that fulfills all the conditions for forming the model.
Descending Broadening Wedge pattern.
On the following chart, you will see the Dow Jones index (DJI) breached
the upper border of the pattern on November 10, 2023, with a long green
candlestick to announce the bullish target based on the
Descending Broadening Wedge pattern.

|
| Dow Jones Industrial Average (DJI) - Daily chart |
The bullish target lies around level 36148, and the bullish target has already
been reached on December 1, 2023, by reaching the level of 36264, accordingly,
the Descending Broadening Wedge pattern has achieved its goal
and no other goal is left on this pattern.
Inside Day Pattern.
However, the Dow Jones index (DJI) in today's session, December 4,
2023, has formed another pattern called the Inside Day pattern which is
shown inside the red circle, draws attention that it came in line with the
goal of the Descending Broadening Wedge pattern and formed
around it.
Inside day pattern's upside target.
Therefore, the Inside day pattern is currently important, so you can
use this pattern to give entry or exit signals based on dealing with the
highest value of a tall bar or candle which is called the Mother
candle/day, which is the level of 36264 by closing above this level means to
continue to raise up to achieve the nearest goal, in this case, is the level
of 36613.
Inside day pattern's downside target and stop loss.
If the 35914 level is broken down, this gives a downside target for the
Dow Jones index (DJI) about 35567. And do not forget the famous
behavior of DJI, the Dow Jones index (DJI) is known for covering (closing) the
Price Gaps previously left behind, whether up or down.
Price Gaps support levels.
One of these Price Gaps is currently the price gap between
34581 and 34405. Then the price gap between the level of 33946 and the level
of 33852. The third price gap he left behind on an upward journey was the
first price gap being at the beginning of the rise on the first of November
2023 between the level of 33450 and the level of 33337.
All of the above Price Gaps represent future support levels
in the event of a downward trend. The bearish signal starts with a break of
35473, which represents a moving support level upwards.
Now today's article ends, and we will soon meet in a new article on the
Dow Jones index (DJI) and the US market.

-short-term-technical-tnalysis-inv.jpg)


-short-term-technical-tnalysis-inv.jpg)
No comments:
Post a Comment